melodiesasmedicine@gmail.com

Influence of Music Therapy and Music-Based Interventions on Dementia: A Pilot Study
Introduction
Dementia and Therapeutic Treatments
Dementia, depending on its characteristics, negatively affects different cognitive domains—“memory, thinking, orientation, understanding, calculation, ability to learn, language, and judgment” (World Health Organization [WHO], 2020a). Approximately, 50 million people worldwide currently suffer from dementia, caused by Alzheimer’s disease or related diseases. In addition, the content and the intervention effort of the respective therapy methods vary depending on the severity and course of the disease.
Music Therapy and Music-Based Interventions
The American Music Therapy Association (AMTA) defines music therapy (MT) as “the clinical and evidence-based use of music interventions to accomplish individualized goals within a therapeutic relationship by an certified individual who has completed an approved music therapy program” (AMTA, 2020). Music therapy can be used as an alternative therapy and can function as a medium for people with dementia (PwD) to engage more actively with their environment and to better express their emotions (Elliott & Gardner, 2018; Götell et al., 2009). Although dementia is characterized in particular by a disturbance of higher cortical functions (such as memory, thinking, and judgment) (WHO, 2020b), PwD can often still remember the lyrics of songs they learned as children (Hubbard et al., 2002). Long-term music memory is still intact for a long time in PwD and is less affected by the typical metabolic disorders and nerve cell loss. Long-term music memory is not located in the hippocampal area, where ordinary memories are stored, but in the supplementary motor cortex, which is responsible for complex, motor movements (Jacobsen et al., 2015). The results of the study by Jacobsen et al. (2015) also suggest that long-term music memory is better preserved than short-term memory, autobiographical long-term memory, or language.
In addition, the use of MT in people with cognitive impairments and dementia can help improve the perceived quality of life and well-being (Cho, 2018; Liesk et al., 2015) and may delay the progress of the disorder (Kampragkou et al., 2017).
Furthermore, there are nursing homes that provide music-based interventions (MBI) additionally to MT. These MBI provide music with or without the credentialed therapist; however, they are not always individualized. Some studies mention the terms “individualized MT” and “group MT,” although they are in fact MBI (Sakamoto et al., 2013; Sung et al., 2006). Since MBI are considered more a leisure activity than a therapeutic intervention, those services are not adapted to the individual needs and musical preferences of the PwD (van der Geer et al., 2009). Individualized music is not only important in MT but also in MBI. Benefits of individualized MBI also show positive effects in terms of physiological, psychological, and emotional impacts (Hebert et al., 2018; Huber et al., 2020; Ray & Mittelman, 2017; Thomas et al., 2017; Weise et al., 2020).
With regard to the music implementation in the daily structure of nursing homes, some European countries (such as the Netherlands, Luxembourg, Belgium, Great Britain, France, Norway, Denmark, and Finland) as well as other countries in the world (such as Australia and the United States) act according to the National Dementia Plan, which provided guidelines for this music implementation (Alzheimer’s Disease International, 2020). The majority of music intervention studies within this setting of nursing homes consist of active MT and receptive MT (Narme et al., 2014; Raglio et al., 2015), without including MBI. However, there is a lack of studies investigating the influence of technology-based music interventions (TBMI), for example, via mobile devices or TV, on Behavioral and Psychological Symptoms of Dementia (BPSD). In summary, little is known about the impacts of the use, acceptance, and interaction of MT and TBMI by PwD with BPSD in the context of long-term care settings.
Research Questions
Both the frequency of use and acceptance, as well as the impact of music therapy (active and receptive) in the context of TBMI on behavioral symptoms in PwD within nursing homes are rarely considered in the literature.
- What was the frequency of use and acceptance of the different music interventions (MT and TBMI) offered to PwD in nursing homes?
This basic research question suggests the investigation of secondary research questions:
- What is the relationship between use/acceptance and sociodemographic data (age, gender, and dementia)?
- Does high versus low usage impact observed BPSD exhibited by persons with dementia?
- What influence do the music interventions have on the BPSD such as agitation, apathy, depression, and quality of life over time?
Methods
Procedure
Due to our focus on evaluating the influence of MT and TBMI for nursing home residents, the researcher (certified study director and study staff according to the international GCP guidelines) conducted a bicentric study to question PwD and their related persons (RPs). An RP is defined as a person who has maintained a social relationship with the PwD in daily life and is informed about his or her physical and cognitive limitations. Since the majority of PwD had few or no relatives, most of the RPs were professional caregivers.
Over a period of 14 weeks, the pilot study was conducted in three nursing homes with 30 PwD. Three nursing homes, two in Berlin and one in Stuttgart, Germany, took part in the study (1. nursing home in city area, no focus on specific diseases, 74 PwD in total; 2. nursing home in city area, focus on PwD with higher support and security needs, 69 PwD in total; and 3. nursing home in city area, closed gerontopsychiatry, focus on mental illness in old age, 69 PwD in total).
Inclusion criteria of PwD were a minimum age of 65 years, extensive independence (had to be able to participate independently in the musical interventions), and a clinically diagnosed dementia. The exclusion criterion was a lack of verbal expression (should be able to express music preferences or dislikes toward music songs).
All participants, the RP and the PwD themselves, in the case of the ability to consent or in the presence of relatives, were informed about the course and content of the study by providing written and oral study information. After that, all participants gave written informed consent. The selection of the PwD, who took part in the study, was made by the caregivers in the nursing homes. Due to the limited ability of all participated PwD to consent due to the severity of their disorder, the questionnaires were answered by an RP (external assessment questionnaires).
The study protocol was prepared in accordance with the standards of the Declaration of Helsinki and approved by the Ethics Review Committee and the Data Protection Committee of the Charité. All participants gave their written informed consent to take part in the study. In addition, the study is listed in the German Clinical Trials Register under the number DRKS00011552.
Treatment fidelity
The study team, the credentialed music therapists, the fitness trainer, as well as the caregivers were informed about the course of the study, the content, their tasks, and the goal of the pilot study before the study. The adherence and the fidelity to these general conditions for the music intervention were ensured before the study by manualized study protocols and manuscripts for each stakeholder, during and after the study by personal consultations and monitoring. The monitoring in terms of adherence to the fidelity of the protocol manual took place as part of the Dementia Care Mapping (DCM) observation (not part of this paper, submitted elsewhere).
An instruction session was prepared and conducted for the caregivers prior to the study, in which they were informed about the overall duration of the study, the content, the intervals, and the location of the music interventions. In addition, the caregivers were taught the exact use of the TBMI as well as the corresponding on and off times of the music devices (e.g., background music and music program in common room). In addition, the caregivers were able to ask questions during the training course and to relieve fears and concerns about the study.
After the instruction session, flyers were put up in the rooms where the regularly occurring music interventions were displayed. A study folder with all important details about the study and contact addresses for the study team was kept in the caregivers’ room. If necessary, questions and problems of the caregivers were clarified by telephone or in person. In addition, the functionalities of the music devices were tested and recorded at least 2–3 times per week.
Materials
The study was divided into four study phases. The baseline phase T1 (two weeks), followed by the eight-week intervention phase (T2 and T3), and the four-week follow-up phase (T4).
In T1, the Mini-Mental-Status Examination was conducted with the PwD. Moreover, sociodemographic data of the residents (e.g., age, gender, degree of care, and date of the first diagnosis of dementia) were recorded with questionnaires. In addition, information on the state of health was obtained from the attending physician. All questionnaires filled in by the RP for the PwD in the subsequent study phases (from T2 to T4) included questions on the following topics: instrumental activities of daily life that influence the behavior of PwD (e.g., disruptive behavior/agitation and social behavior/apathy, measured by the subscale of the Nurses’ Observation Scale for Geriatric Patients [NOSGER]; Wahle et al., 1996), depression (Cornell Depression Scale [CDS]; Alexopoulos et al., 1988), and quality of life (QUALIDEM; Dichter et al., 2016). Additionally in T2, questions were asked about expectations of MT and TBMI. In T3, questions were asked about the frequency of use and acceptance of MT and TBMI. To examine the influence of high and low usage on observed BPSD, calculations were made using data from the variable “frequency of use” at timepoints T2 and T3 (see Data Analysis). In fact, at timepoint T4, no music interventions took place. Moreover, in T4, data on the sustainability of MT and TBMI were collected.
Disruptive behavior/agitation and social behavior/apathy (NOSGER)
On a 5-point Likert scale (never, occasionally, often, mostly, and always), the RP evaluated the frequency of occurrence of the corresponding behavioral symptoms. A minimum score of 5 and a maximum score of 25 could be achieved for each dimension. Thus, low dimension scores meant no or only minor losses or disturbances, whereas high values meant significant losses or disturbances in the respective areas. The subscale “Social behavior” of the NOSGER questionnaire was used within this study to calculate the influence on apathy and the subscale “Disruptive behavior” for calculating the influence on agitation. In the following, disruptive behavior is used synonymously for agitation and social behavior synonymously for apathy. The NOSGER questionnaire has good psychometric characteristics in terms of reliability (test–retest reliability: rank correlation coefficient rs = .84 ≤ rs ≤ .92) and validity (criterion validity: sensitivity ≥ 48% and specificity ≥ 69%) (Spiegel et al., 1991; Wahle et al., 1996).
Depression (CDS)
The occurrence of depression among the residents was measured by the CDS, in which a maximum score of 38 points can be achieved. A value of 8 points or more indicates an existing depressive disorder. Overall, the CDS has very good psychometric properties in terms of reliability (e.g., internal consistency: Cronbach’s α = .86) (Amuk et al., 2003) and validity (e.g., criterion validity: sensitivity = 93%, sensitivity = 93%, and specificity = 97%) (Kørner et al., 2006).
Quality of life (QUALIDEM)
The assessment of the quality of life was measured using the validated QUALIDEM instrument, which consists of a total of nine subscales (in a heterogeneous sample, as in this study). The higher the value of the subscale (whereby the scales can reach different scores from min. 12 points to max. 42 points), the higher the quality of life of the person with dementia in each dimension. The QUALIDEM questionnaire has good psychometric characteristics. In terms of reliability, a strong internal consistency was measured in numerous studies (Cronbach’s α > 0.7) (Bouman et al., 2011; Dichter et al., 2011; Gräske et al., 2014). With regard to validity, studies showed good to very good scalability up to three subscales (Loevinger’s H = 0.31 ≤ H ≤ 0.65) (Dichter et al., 2013).
Intervention
The main goal of all provided music interventions was to investigate their usage by PwD in nursing homes and to examine the related influence on BPSD over time. A total of six different types of music interventions (MT and TBMI) were offered to meet the individual preferences and likings of each study participant. These music interventions were interventions that were compatible with both the spatial, organizational, and staffing conditions of the nursing homes.
Group MT
This type of active MT was performed once a week for 45 minutes by a credentialed, certified, and experienced (with the target group) music therapist. The planned group size of the MT group was five study participants. However, other nursing home residents occasionally participated in the sessions by random chance, so that the group size varied (max. 10 participants). The music was improvised, mainly played by the music therapist with a guitar or accordion. In addition, singing bowls and percussion instruments were sometimes used to support the experience of rhythm, which were played by some participants in the study.
Individual MT
The individual MT was conducted in the context of receptive MT. This music intervention was performed every two weeks (alternating weeks with group music with movements) for 30 minutes by a credentialed, certified, and experienced (with the target group) music therapist for only one study participant each. The music was played by the music therapist using a guitar.
Background music
This TBMI was played by caregivers daily during each meal (breakfast, lunch, 3:00 p.m. tea, and dinner) for all study participants for approx. 4 minutes via CD player. It was standardized and suitable music for the respective meals.
Group music with movements
This TBMI was performed every two weeks (alternating weeks with individual MT) for 60 minutes by a certified fitness trainer for physical activation. The planned group size was 10 study participants, which was not exceeded. The music was a prepared music playlist that was transmitted via TV. The music selection was based on a biographically relevant approach.
Music program in common room
This TBMI in the common room was turned on and off by caregivers and was made available to each study participant every day from 10:00 a.m. to 04:00 p.m. via TV and an external hard disk. Other nursing home residents also took advantage of this offer. On days when other MBI or MT were offered in the common room (e.g., group music with movements), the music program was turned off at this time. The following music program was played: karaoke (both with traditional continuous text and with text sung by an older person), pictures/videos accompanied by music, and provided instruments.
Individual radio
This TBMI was played automatically twice per day for a maximum of 30 minutes in the resident’s own room at an individual volume. The automatic playing time varied according to the needs of the study participants. All music songs were played at an appropriate volume for the PwD, and the playing speed was adjusted (slowing down). Further information on the interventions (e.g., theoretical reference) can be found in Supplementary Tables 2 and 3.
Data Analysis
The data from the questionnaires were collected paper-based within the clinical study and afterward transformed into digital data using Microsoft Excel. The analysis for the evaluation of the questionnaires was carried out using the statistical program IBM SPSS Statistics 27 (IBM Corp, Armonk, New York).
In order to investigate the influence of high usage or low usage to timepoints T2 and T3, bivariate and multivariable analyses with the variable “Frequency of use on MT and TBMI” (collected at T3), a total sum of all these variables (e.g., group music therapy and karaoke) was calculated. Accordingly, low values reflected a high usage of MT and TBMI and high values reflected a low usage of MT and TBMI (“1” = “very much used,” “4” = “very less used,” “5” = “not used,” “6” = “don’t know”). Values 5 and 6 and missing values were excluded from the calculations. In order to carry out further calculations, this new variable was dichotomized to distinguish the sample between “residents with high usage” and “residents with low usage.” A median was calculated (Mdn = 27, min = 9, and max = 45). To calculate the influence of MT and TBMI usage on agitation, apathy, and depression, nonparametric Mann–Whitney U-tests were performed on the change scores between T2 and T3. For the variable quality of life, independent samples t-test was used.
Correlations of acceptance and use of MT and TBMI in relation to gender were calculated using a univariate analysis of variance. For the variables age and Mini-Mental State Examination correlations according to Pearson were calculated.
A Friedman test was conducted to investigate the influence of MT and TBMI on agitation (N = 24), apathy (N = 24), and depression (N = 23) on the raw scores at different timepoints (k = 3). In the case of normal distribution (only with variable quality of life), a one-way Analysis of Variance with repeated measures (p-values corrected according to Bonferroni) (N = 11) was performed.
Results
Participants
The total sample of PwD (see Table I) included 30 persons (n = 18; 60.0% female and 60.0% widowed) aged 52 to 97 years (M = 81.4 years) from three different nursing homes. The average MMSE score was 8.5 points (SD = 7.4 points), which corresponds to severe dementia. With regard to musical activities, the RP stated that 83.3% (n = 25) of the interviewed PwD regularly listened to music, 16.7% (n = 5) of the residents still handled this independently, while the majority (n = 25; 83.3%) of PwD were dependent on support for it (e.g., to turn on a music player). Therefore, it seems plausible that 96.7% (n = 29) did not play an instrument anymore. In addition, the residents preferred to listen to folk music and pop songs (n = 26; 86.7%), followed by classical music and opera (n = 10; 33.3%) as well as pop music/musicals (n = 7; 23.3%) and rock (n = 3; 10.0%), according to the RP. The number of PwDs interviewed decreased over the measurement timepoints (T1–T4). One of the reasons for this was the death of five PwD during the study (see Figure 1).
Table I Sociodemographic Data of the PwD and RP
| Characteristics | Forms | PwD | RP |
|---|---|---|---|
| Sample size (n) | Total | 30 | 9 |
| Female | 18 | 7 | |
| Male | 12 | 2 | |
| Age (Ø years, ± SD) | Total | 81.4 ± 9.0 | 48.7 ± 8.2 |
| Female | 82.7 ± 8.1 | 48.5 ± 8.9 | |
| Male | 79.5 ± 10.3 | 49.6 ± 5.9 | |
| MMSE (Ø points, ± SD) | Total | 8.5 ± 7.4 | N.A. |
| Frequency of contact PwD & RP (in %) | Less than once a month | 0.0 | |
| Once a month | 0.0 | ||
| Weekly | 0.0 | ||
| More than once a week | 10.0 | ||
| Daily | 56.7 | ||
| Several times a day | 33.3 | ||
| Favorite music genre (in %) | Folk music | 86.7 | |
| Classic songs/Opera | 33.3 | ||
| Pop music | 23.3 | ||
| Rock music | 10.0 | ||
| Jazz/Blues | 0.0 |
Note. PwD = people with dementia; RP, related person; SD, standard deviation. Multiple answers were possible for the item “favorite music genre.”
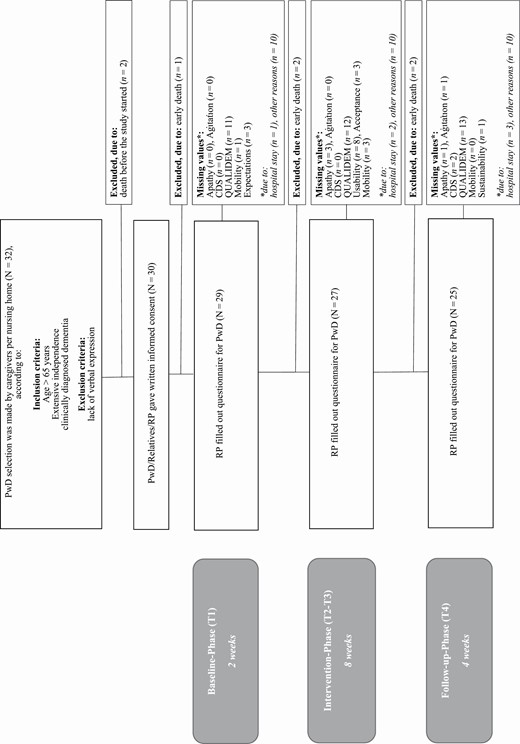
Figure 1
Open in new tab Download slide
CONSORT diagram.
The sample of RP (n = 9) included nurses (n = 8) and an occupational therapist (n = 1) (77.8% female) with an average age of 48.7 years. The majority of the RP (n = 20; 90.0%) had daily or even several times a day contact to the residents.
Frequency of Use and Acceptance of MT and TBMI
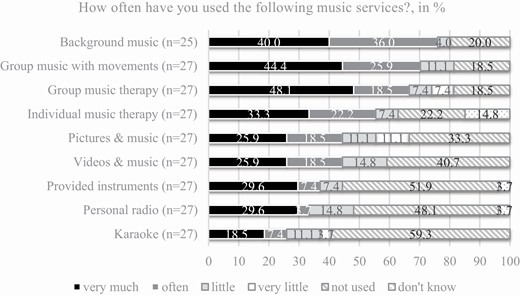
As shown in Figure 2, the frequency of use of MT and TBMI was surveyed on a 6-point Likert scale (“1” = very often and “6” = do not know). Frequent use of group music with movements (n = 19; 70.3%), group MT (n = 18; 66.6%), and individual MT (n = 15; 55.5%) was also reported by the caregivers. The frequency of use of the technically supported music interventions, for example, karaoke and biography-specific favorite music, was lower than the frequency of use of the personnel-guided music interventions (similar to the acceptance of the music interventions). According to the RP, the reasons for nonuse were mainly health problems of the residents (n = 11; 42.3%), memory about the existence of the music interventions (n = 9; 34.6%), tendency to retreat (n = 3; 11.5%), and motor restlessness (n = 1; 3.8%). More than half of the RPs felt the common music room with its alternating music program (e.g., karaoke, music accompanied by pictures, and musicals) as appropriately equipped for older people (n = 16; 59.3%) and for PwD (n = 17; 62.9%). In addition, the RPs reported that 63.0% (n = 17) of the residents to have liked the choice of music interventions pretty much or very much. No significant correlation was found with regard to the frequency of use on MT and TBMI with gender (F(1, 28) = 0,67, p = .42, partial η2 = .02), age (r = .29, p = .13), and MMSE (r = .21, p = .29).
Figure 2
Open in new tab Download slide
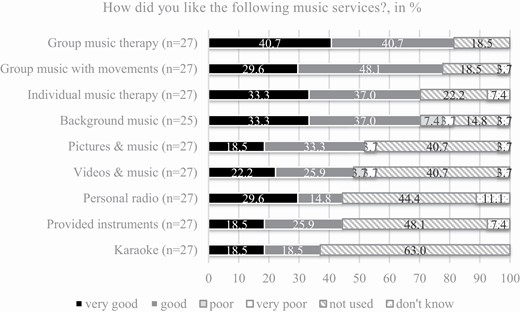
Frequency of use on music interventions.As shown in Figure 3, the frequency of acceptance of MT and TBMI was surveyed on a 6-point Likert scale (“1” = very good and “6” = do not know). With regard to the acceptance of the PwD toward individual music interventions, group MT (n = 22; 81.4% good or very good) was rated best, along with the group music with movements (n = 21; 77.7% good or very good) and individual MT (n = 19; 70.3% good or very good) (see Figure 7). No significant correlation was determined with regard to acceptance of MT and TBMI with gender (F(1, 28) = 0,60, p = .45, partial η2 = .02) and MMSE (r = .26, p = .18). A significant correlation was found only with regard to age (r = .40, p < .05).
Figure 3
Frequency of acceptance on music interventions.
Agitation and Apathy
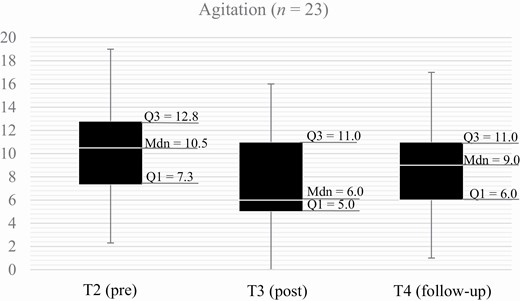
Considering the influence of MT and TBMI on agitation at times T2 and T3, agitation was found to decrease more strongly among the residents with a high usage of MT and TBMI (Mdn = −4.5, Q1 = −7.5, Q3 = −1.5) than among those with a low usage of MT and TBMI (Mdn = 0.0, Q1 = −2.5, Q3 = 1.5; U = 41.00, p < .05).
Figure 4 shows a reduction of agitation at time T3 (Mdn = 6.0 points, Q1 = 5.0, Q3 = 11.0) compared with T2 (Mdn = 10.5 points, Q1 = 7.3, Q3 = 12.8). In addition, the median value of agitation after the intervention at time T4 increased slightly to 9.0 points (Q1 = 6.0, Q3 = 11.0). The overall influence of time was significant (Friedman test: Chi square = 7.35, p < .05, n = 24).
Figure 4
Distribution of agitation scores over time.
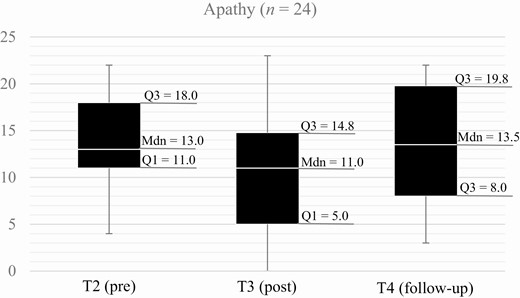
The comparison between T2 and T3 shows that the apathetic behavioral symptoms of residents with a high usage of MT and TBMI (Mdn = −6.0, Q1 = −9.0, Q3 = −2.5) decrease more than those with a low usage of MT and TBMI (Mdn = 1.0, Q1 = −2.0, Q3 = 3.0; U = 36.50, p < .01).
Figure 5 shows the same tendencies for apathy scores. The median apathy score in T2 decreased from 13.0 points (Q1 = 11.0, Q3 = 18.0) to 11.0 points (Q1 = 5.0, Q3 = 14.8) in T3 and increased slightly to a total of 13.5 points (Q1 = 8.0, Q3 = 19.8) at time T4. However, the overall influence of time was not significant (Friedman test: Chi square = .886, p = .64, n = 24).
Figure 5
Distribution of apathy scores over time.
Depression
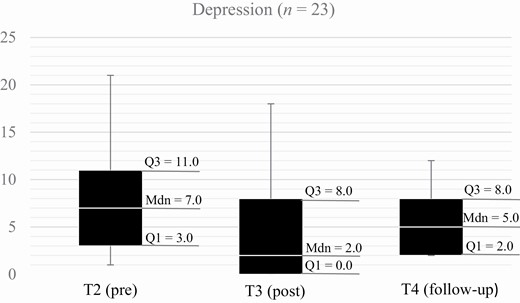
No significant differences in depressive symptoms at times T2 and T3 in PwD with high usage of MT and TBMI (Mdn = −8.0, Q1 = −11.5, Q3 = −0.5) compared with PwD with low usage of MT and TBMI (Mdn = −2.0, Q1 = −4.0, Q3 = 0.5) were detected (U = 63.00, p = .20).
As shown in Figure 6, at time T2 (Mdn = 7.0 points, Q1 = 3.0, Q3 = 11.0) of the noncontrolled intervention study, depressive disorders were observed on median in PwD. At time T3 (Mdn = 2.0 points, Q1 = 0.0, Q3 = 8.0), a decrease of the median value in depressive symptoms of the residents was observed, which increased slightly to a median depression score of 5.0 points (Q1 = 2.0, Q3 = 8.0) in the follow-up phase in T4. However, there were no significant differences between these measurement points (Friedman test: Chi square = 4.57, p = .10, n = 23).
Figure 6
Distribution of depression scores over time.
Quality of life
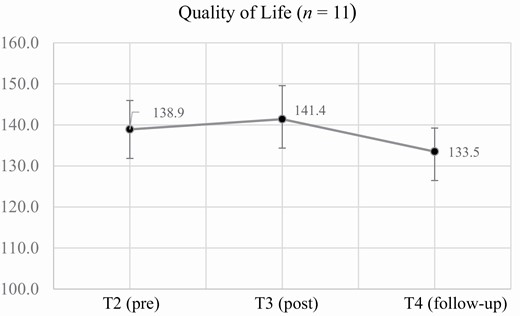
Comparing the changes in quality of life in T2 and T3 between residents by means with a high usage of MT and TBMI (M = 6.0, SD = 4.6) and those with a low usage of MT and TBMI (M = 4.3, SD = 13.1), no significant differences were observed (t(13) =. 21, p = .84).
The results of the subscales of the quality of life measuring instrument (see Figure 7) were summarized as a total average score. The one-way ANOVA with repeated measures shows an improvement in quality of life with MT and TBMI. The quality of life of PwD increased on average from time T2 from 138.9 points (SD = 23.4) to 141.4 points (SD = 27.1) in T3. However, at time T4, it decreased again on average by 7.9 points (M = 133.5, SD = 19.0). There was no statistically significant difference for all timepoints (F(2,20) = 3.18, p = .06, partial η2 = .24).
Figure 7
Average quality of life scores over time.
Discussion
The purpose of this nonrandomized and noncontrolled 14-week pilot study was to assess the impact of frequency of use and acceptance of individual-based MT and TBMI in nursing homes on PwD. The focus was to consider (1) the relationship between use/acceptance of music interventions and sociodemographic data, (2) influence of high/low usage of music interventions on PwD’s BPSD, and (3) influence of music interventions on PwD’s BPSD over time.
Results Reflection
Descriptive results showed higher frequencies of use and acceptance of the music interventions delivered during personnel-guided MT and TBMI (such as individual MT, group MT, and group music with movements) compared with the music interventions that were only technology based and played without guidance. This result seems to indicate that actively guided and individual-based music interventions delivered by qualified personnel are better accepted by PwD than technique-based music interventions only. Furthermore, these results imply that the integration of individual-based music into the standard patient care of an inpatient nursing home setting can succeed despite the involvement of external staff (music therapists and fitness trainers) and the disadvantages that may be associated with this (e.g., lack of knowledge about the facility and residents and negative working atmosphere/unrest in the internal team).
In addition to song selection for individual-based and biographically relevant implementation of the music interventions, caregivers were also responsible to turn music on and off (except for the automatic individual radio). The results of nonuse of the different music interventions indicate that, despite multiple training courses, it appears that there were challenges in using technology. The music devices used were not adapted to the operability of the target population of PwD (e.g., to the requirements of progressive dementia)/caregivers (e.g., to the requirements for the level of technical knowledge) nor were they adapted for use within the nursing home setting. This issue was indicated by Ruggiano et al. (2019) in their study. Therefore, according to this study by Ruggiano et al., having providers of such technologies assist in the selection process to assess and meet the specific needs of each stakeholder and provide solutions to problems can be a solution. For example, instruction sessions, consultations, and monitorings with all those persons involved (including external music therapists) who are engaged in the implementation of the music interventions are indispensable in order to prevent technical anxieties, problems, and difficulties. In order to increase use and acceptance, providers of TBMI should always consider the individual functional, cognitive and emotional needs, and activities of users in the development, whether they are caregivers or PwD (Langley et al., 2020). Therefore, in the future, MT and TBMI should ensure to use musical instruments, music devices, and music programs in a user-friendly, intuitive manner that focuses on the individual needs of persons with dementia (Gerdner, 2019). For people (e.g., relatives) who assist PwD in the use of TBMI, continuous further training is necessary (Hahna et al., 2012) to ensure that they have the skills to use the latest technology and to promote their own readiness and acceptance of technology.
However, although the relationship between use and age was not statistically demonstrated, significance was found between acceptance and age. As other studies have found (Czaja et al., 2006; Venkatesh & Davis, 2000; Venkatesh et al., 2003), the results (age: M = 81.4 years; MMSE: M = 8.5 points) of this study also indicate that certain factors, such as age, have an impact on technology acceptance. However, future studies using a larger sample would need to investigate, for example, the strength of the association of age and cognitive status of PwD on the use and acceptance of technology and TBMI.
Furthermore, the results found that agitation and apathy decreased significantly more with high usage of MT and TBMI compared with low usage. Similar to numerous studies demonstrating improvement in BPSD with MT (Lam et al., 2020), this study demonstrated a positive impact entirely of these observed outcomes. Although MT and TBMI were not considered separately in the context of high/low usage, there were no negative abnormalities among PwD that could be attributed to TBMI. In the future, further research and developments in TBMI will make it easier to integrate these technologies into nursing home settings. Furthermore, TBMI always enables individual-based (Hebert et al., 2018; Huber et al., 2020; Thomas et al., 2017; Weise et al., 2020), autonomous, and time-independent access to music, even for those PwD who do not wish to or cannot participate in community offerings such as group MT. To have an exact view of the influence of high/low usage of MT and TBMI on BPSD, further studies are needed that consider both music interventions separately.
Methodological Reflection
The results showed that MT and TBMI exclusively had a significant effect on the observed outcome of agitation over time. In contrast to other studies, no significant effects were found in this study in relation to BPSD outcomes, such as apathy (Tang et al., 2018), depression (Biasutti & Mangiacotti, 2021), and quality of life (Cho, 2018). One reason could be the selection of measurement instruments, for example, the NOSGER scale, which measures apathy and agitation with a few items. The study team had to pay attention to the length of the questionnaires and the duration of the interviews. Therefore, short questionnaires with fewer items per outcome were chosen. In subsequent studies, efforts should be made to ensure that meaningful, reputable, and valid measurement instruments are used for each outcome, such as the Agitated Behavior in Dementia Scale (Logsdon et al., 1999), the Cohen-Mansfield Agitation Inventory (Cohen-Mansfield et al., 1989), and the Pittsburgh Agitation Scale (Rosen et al., 1994).
To obtain valid data, the study team decided to have the questionnaires filled out by other persons instead of the study participants themselves. This was due to the fact that to answer the questionnaires, certain information of the long-term memory needed to be retrieved (e.g., taste in music and abnormalities of the BPSD). One limiting effect is that it leads to certain discrepancies between the subjective perception of the caregivers and the actual feelings and mood of the PwD. There are also ways of dealing with these discrepancies and proxy bias in dementia research (Lacey et al., 2015; Robertson et al., 2020). Future studies should consider interviewing PwD and caregivers. To obtain additional first-person information, it should be considered to track participation and attendance at music interventions. For example, objective observation through video analysis might give more insight into the individual and complex emotional processes and behavior change during MT and TBMI.
Overall, the implementations should be investigated not only by quantitative studies but also by qualitative studies considering all participants (e.g., caregivers) through observations (e.g., DCM) and evaluations in order to identify and validate quality identifying music interventions. Controlled studies with reference to biographically relevant and individualized MBI and TBMI should also be considered in order to compare efficiency with conventional pharmacological studies and studies on active and receptive MT. In addition, long-term effects and larger investigations should be examined in further studies as well as considering other settings, such as outpatient-cared PwD.
Limitations
This study is a novel study to examine the influence involving MT and TBMI on BPSD in dementia. Although this study supports previous research, there are a number of limitations that highlight further recommendations for future research.
When interpreting the results, it should be noted that in this sample PwD were heterogeneous with regard to the progression of the disease, for which a self-assessment of the questions was no longer possible. With regard to this, no individual technical acceptance of the residents in the use of MT and TBMI was measured. Based on the exclusion criteria, the transferability of the results for severe cases of dementia and nonverbal patients seems unclear although MT and music intervention often are highly valued. In addition, no conclusions can be drawn either about the influence of individual music interventions, for example, on the quality of life, or about the influence of TBMI in comparison to conventional methods of MT (group MT). Furthermore, the duration of the eight-week intervention phase of this pilot study seems not sufficient enough to detect long-term effects in PwD with respect to the parameters studied.
Conclusions
The results of this pilot study provide initial evidence that the use and acceptance of personnel-guided music interventions (MT, group music with movements) in nursing homes of PwD are higher than for TBMI (karaoke, pictures/videos with music, and individual radio). In addition, there is evidence that both music interventions decreased agitation and apathy, with greater changes observed in the group of high usage on MT and TBMI. This is the first pilot study that combined both MT and TBMI with each other for PwD in several nursing homes and examined the impact of use and acceptance on different behavioral symptoms. Although changes were demonstrated, further research with larger samples and separate analysis consideration of MT and TBMI is needed to examine the effectiveness of these different music interventions. Nevertheless, the use of TBMI offers a good supplement as a psychosocial intervention for PwD in nursing homes. A major advantage of TBMI is that it can be used in a personal, time-independent, and non-binding manner, and individual music preferences can be accommodated, even when nursing home staff or a music therapist is not available.
Conflicts of Interest
The author know none declared conflicts of interest associated with this publication.
The responsibility for the contents of this publication lies with the authors. The aim of the wider project was to develop a musical system for people with dementia. This was a joint project that ended in September 2018.
This study was supported by the German Federal Ministry of Education and Research (BMBF) under grant number 16SV7371. This research received a specific grant from any funding agency in the public, commercial, or not-for-profit sectors.
We know of none declared conflicts of interest associated with this publication.